dEquity Deck
dEquity turns income-producing buildings into NFTs. Investors buy fractions of a property, receive rent distributions and can sell their tokens on the platform's own DEX instead of waiting out a holding period.
An eleven-slide investor deck in the dark mode of the dEquity platform, running from the solution through product screens and a competitive table to tokenomics, a roadmap and the closing opportunity slide.





One dark frame for the problem, solution and product
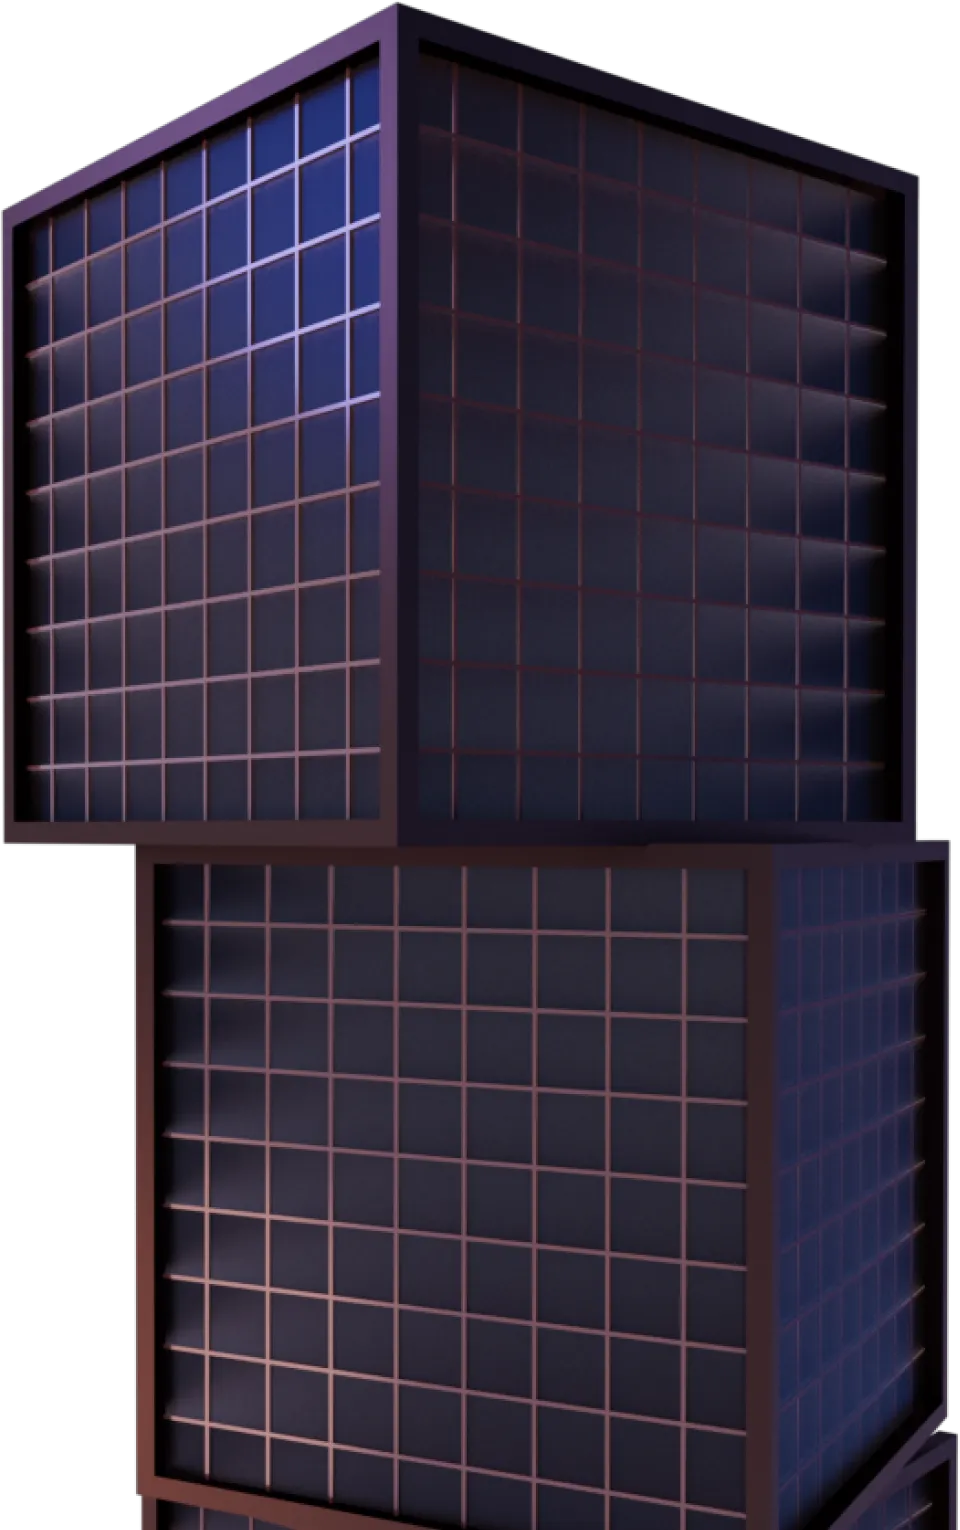
After a cover that places the stacked glass tower over a wave of thin lines shifting from blue to orange, every slide repeats one frame on a near-black ground with a faint grid: the squared-off dEquity wordmark top left, an orange section label top right, a thin orange rule across and a vertical one that splits headline from text. Headlines start white and turn grey towards the end of the line, so the opening words of each claim land first.
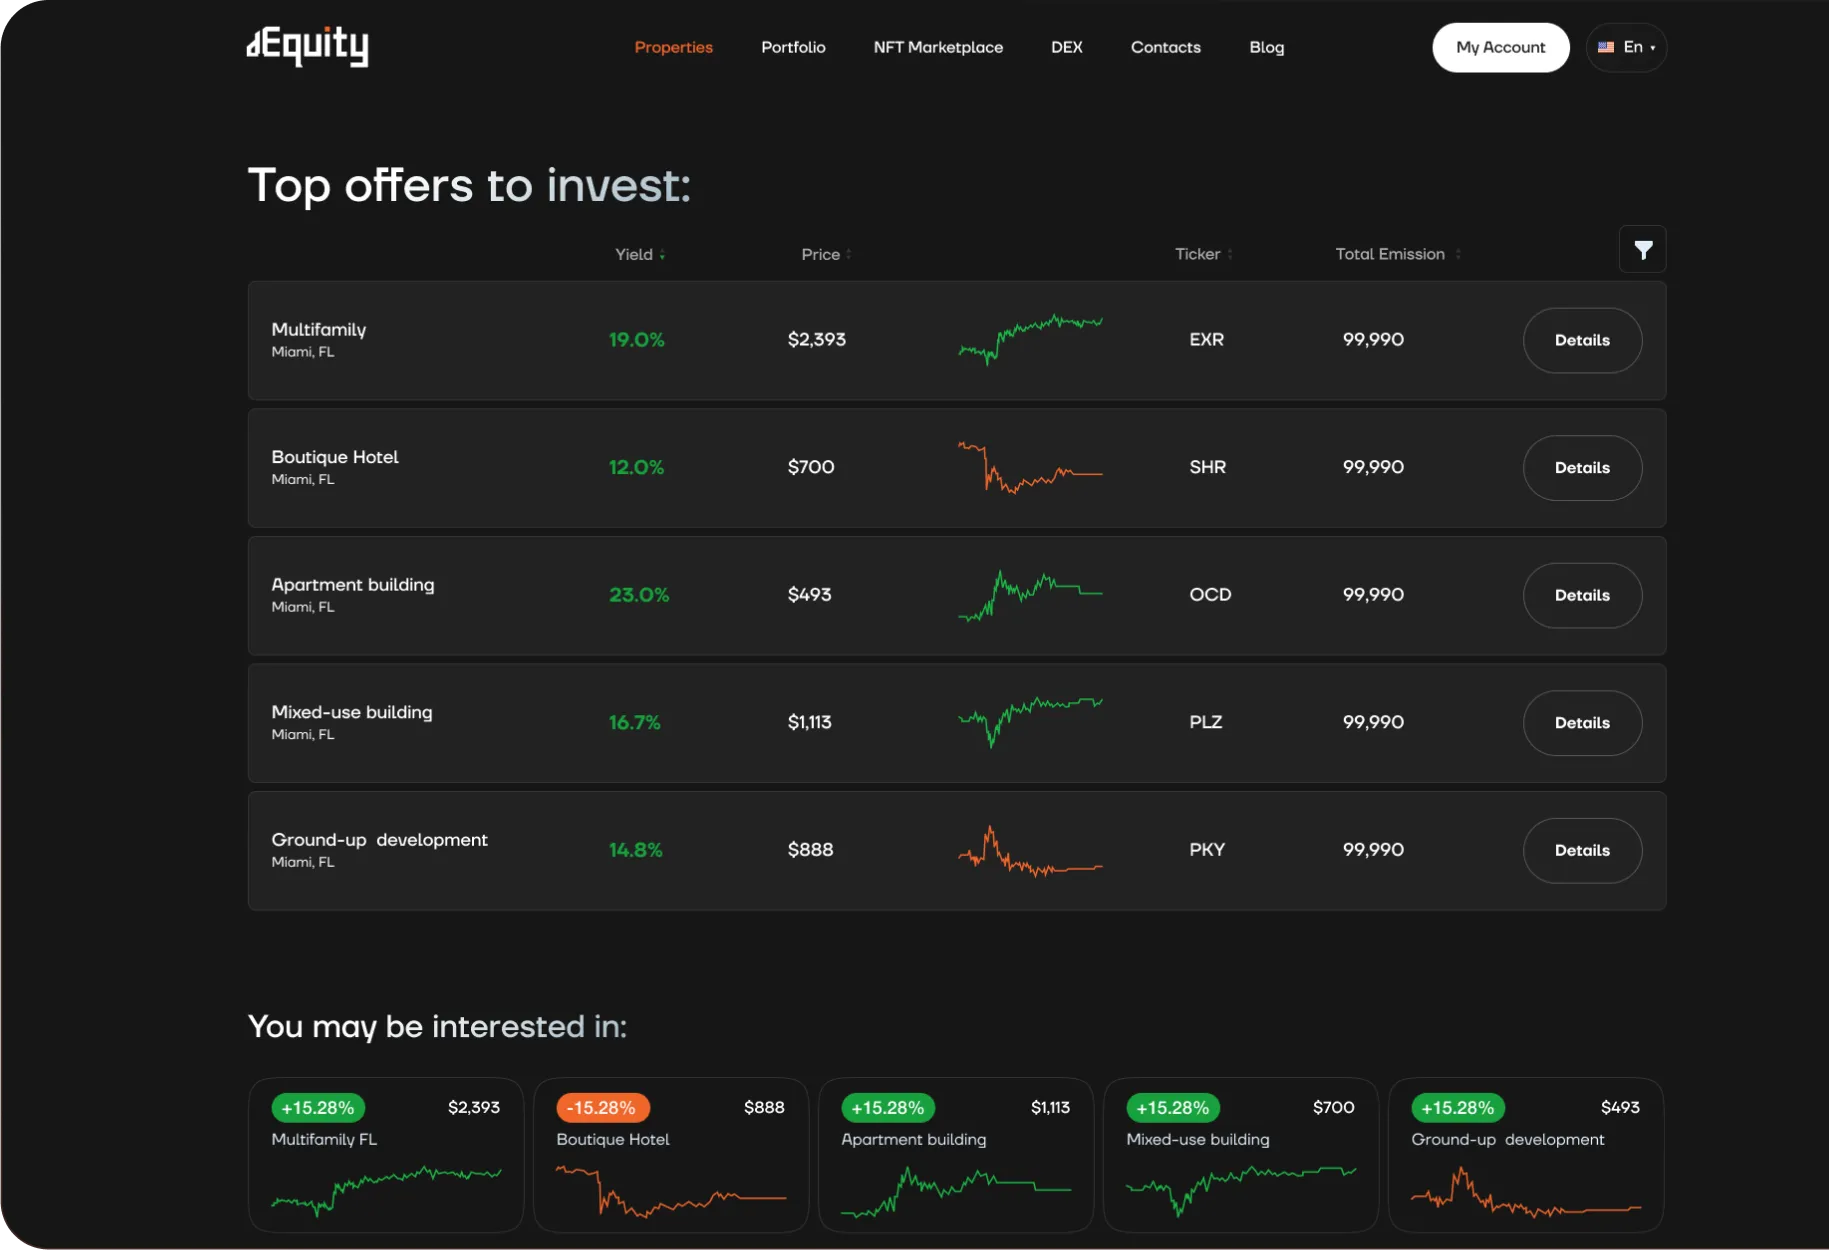
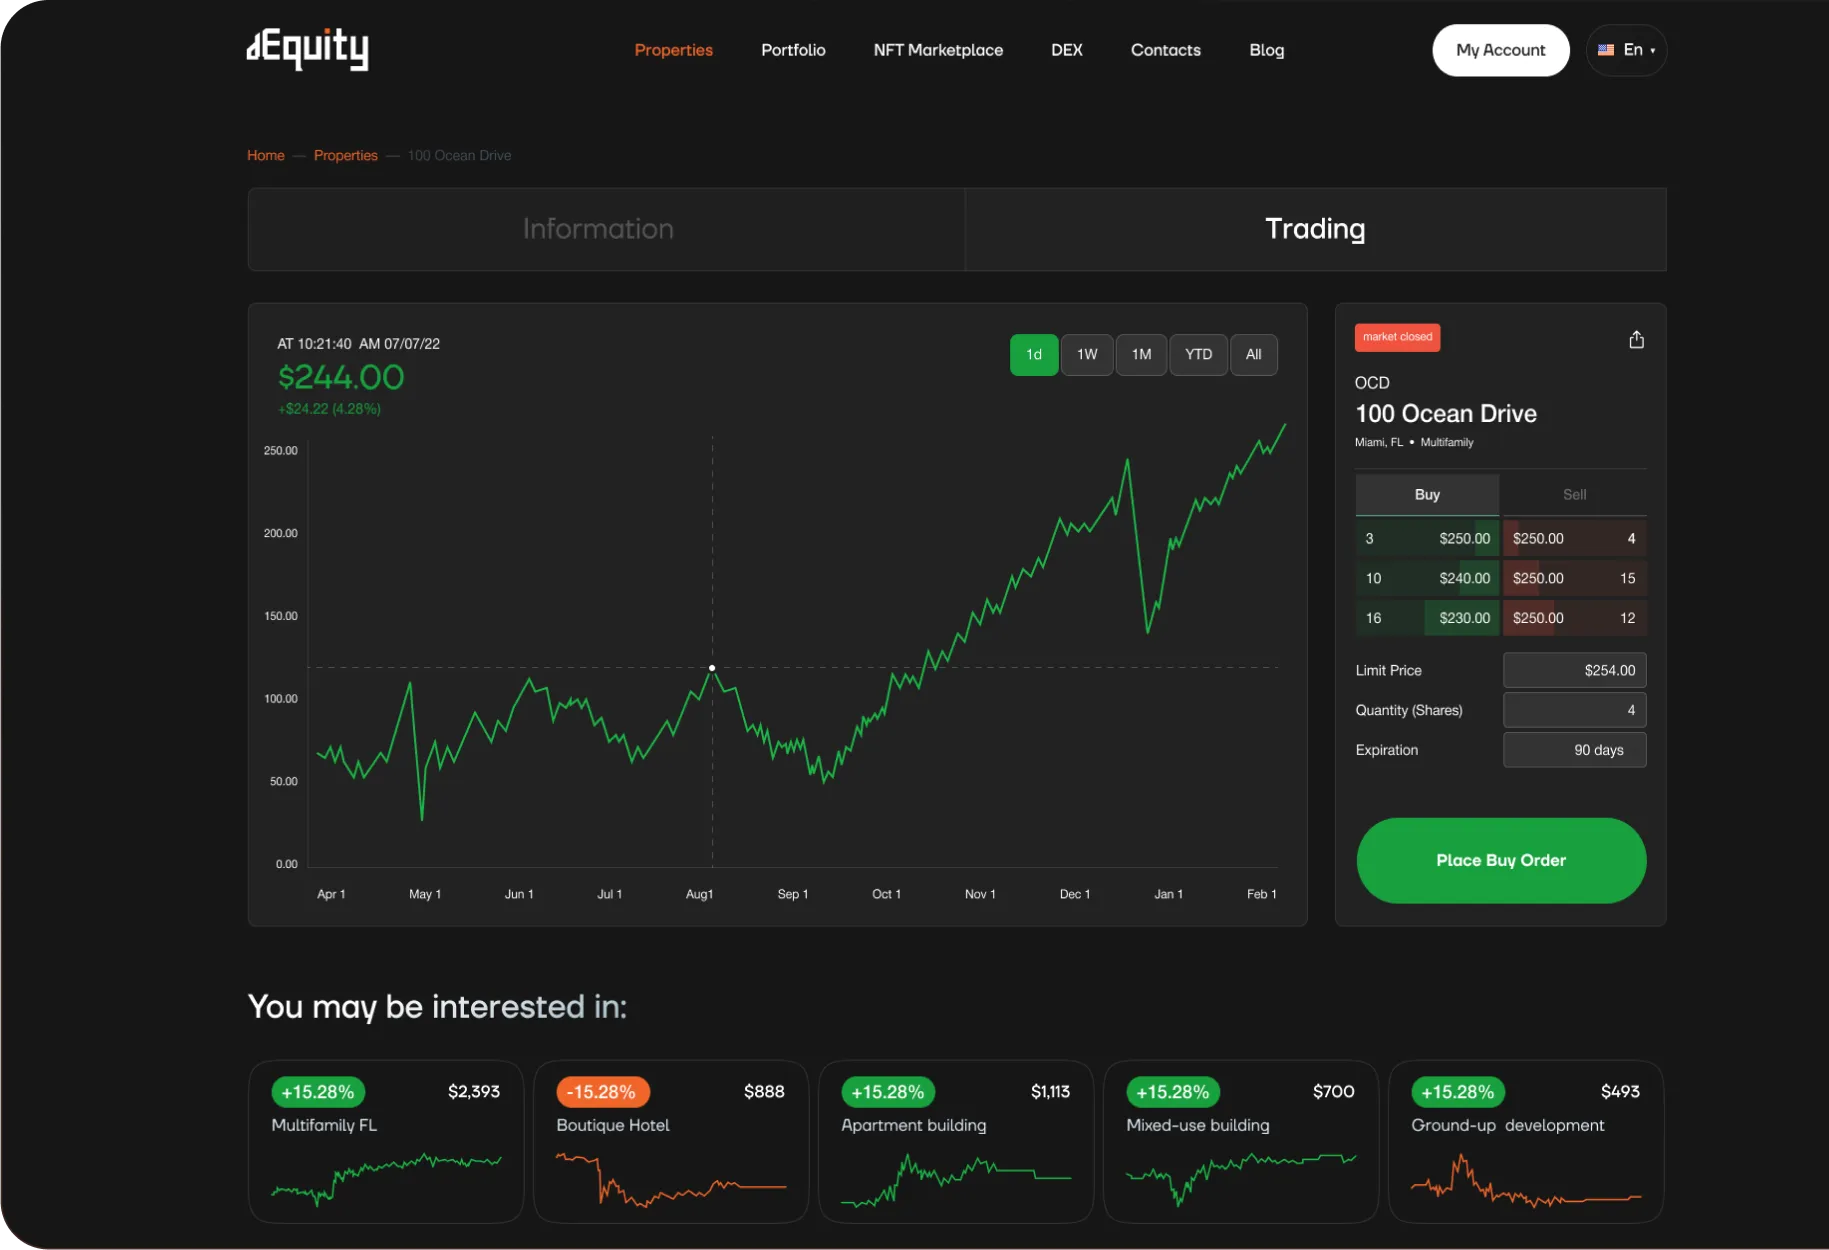
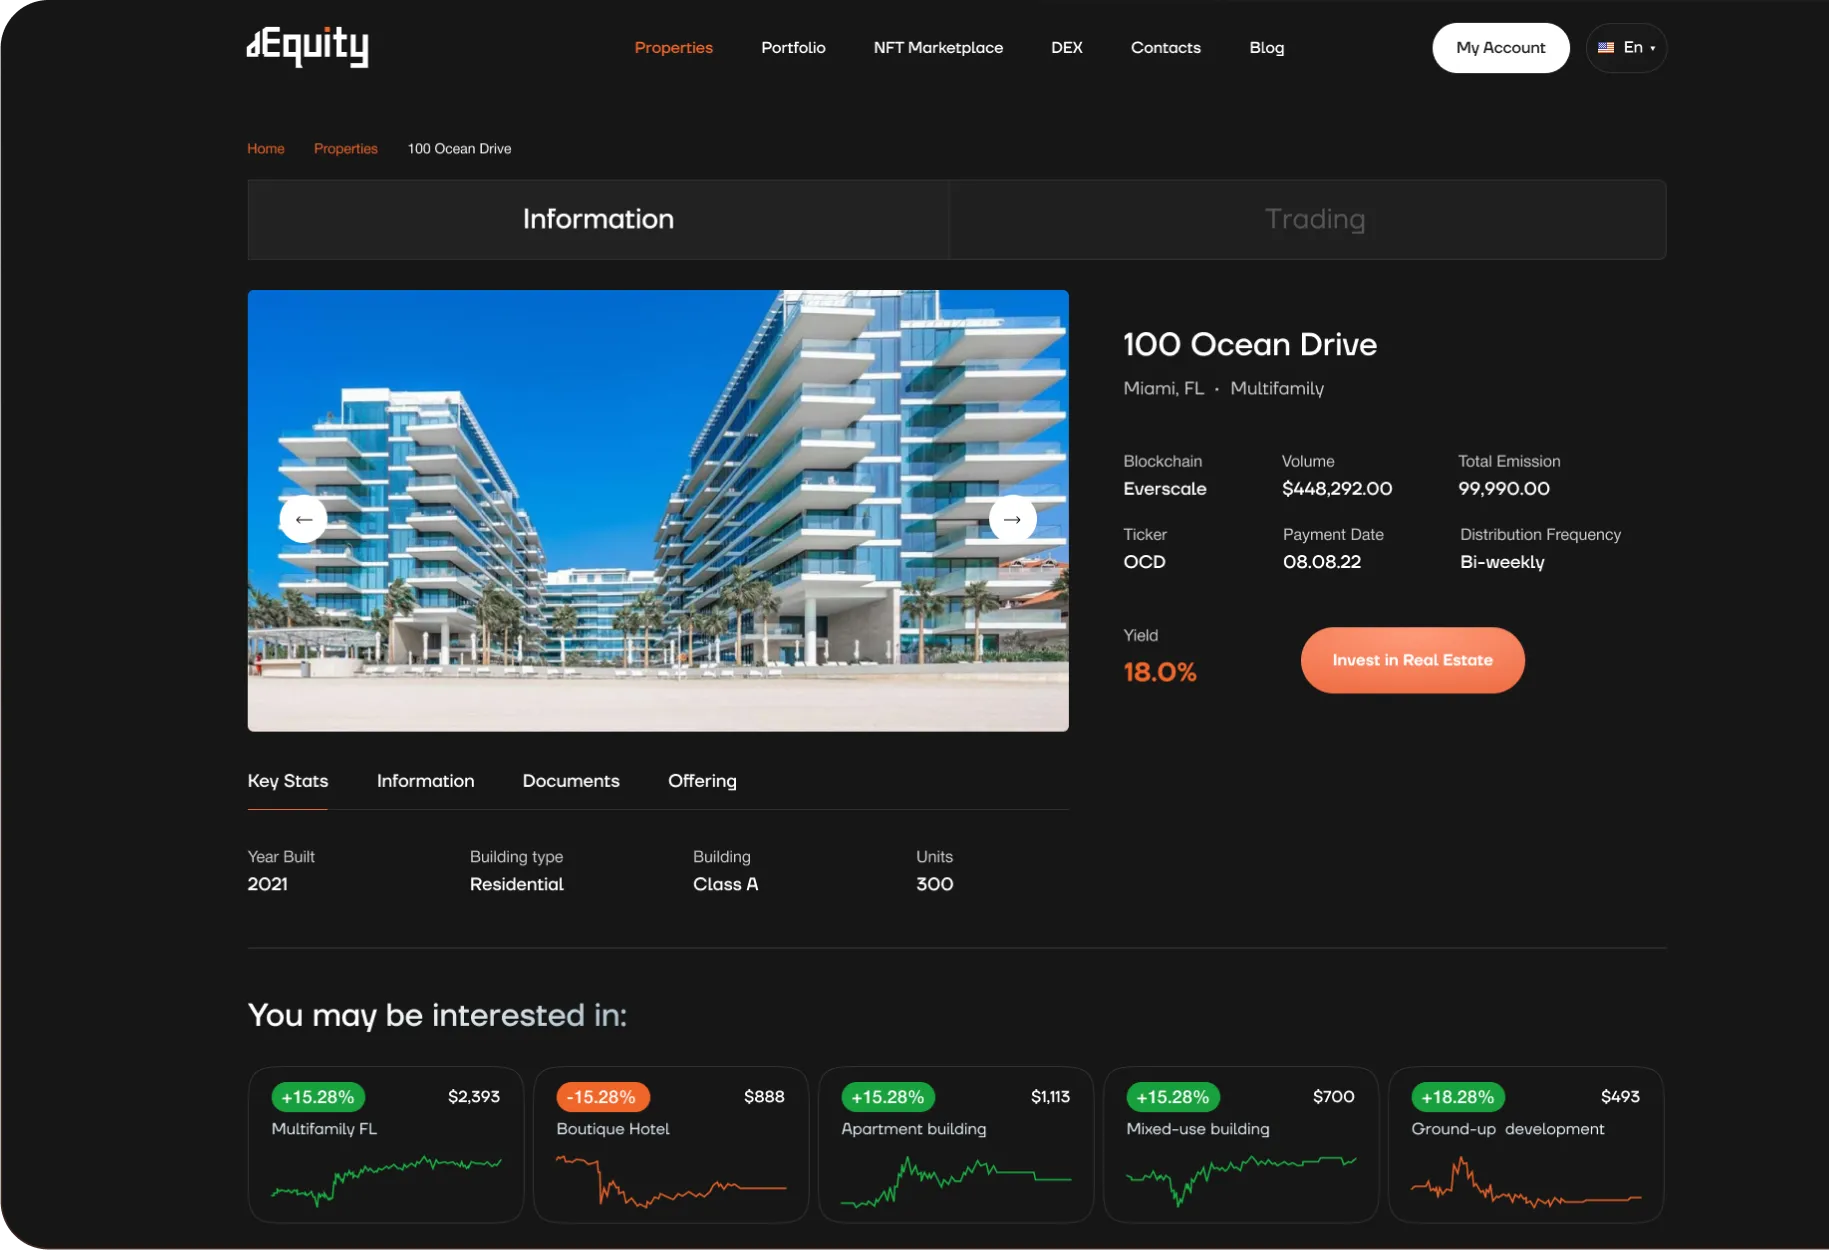
The second Solutions slide adds a green area chart climbing behind the text and picks out annual yield in bold orange. Three product slides then drop the rules and hand two thirds of the frame to the platform: High-Yield beside the Top offers to invest table with a sparkline per building, the liquidity slide beside the trading view with its price chart and order panel, and Accessible to all beside a property page with a photo and an orange Invest button.





























Comparison table, tokenomics charts and a roadmap
The Competitive Landscape slide sets dEquity against direct purchase, REITs and another tokenization platform across seven criteria, from convenience and speed to lending, referrals and NFTs. Tone carries the verdict: where an option falls short the answer is grey, where it delivers it is white, so the dEquity row is the only one that reads white from end to end. Thin orange rules under the header and between rows tie the table to the frame of the other slides.
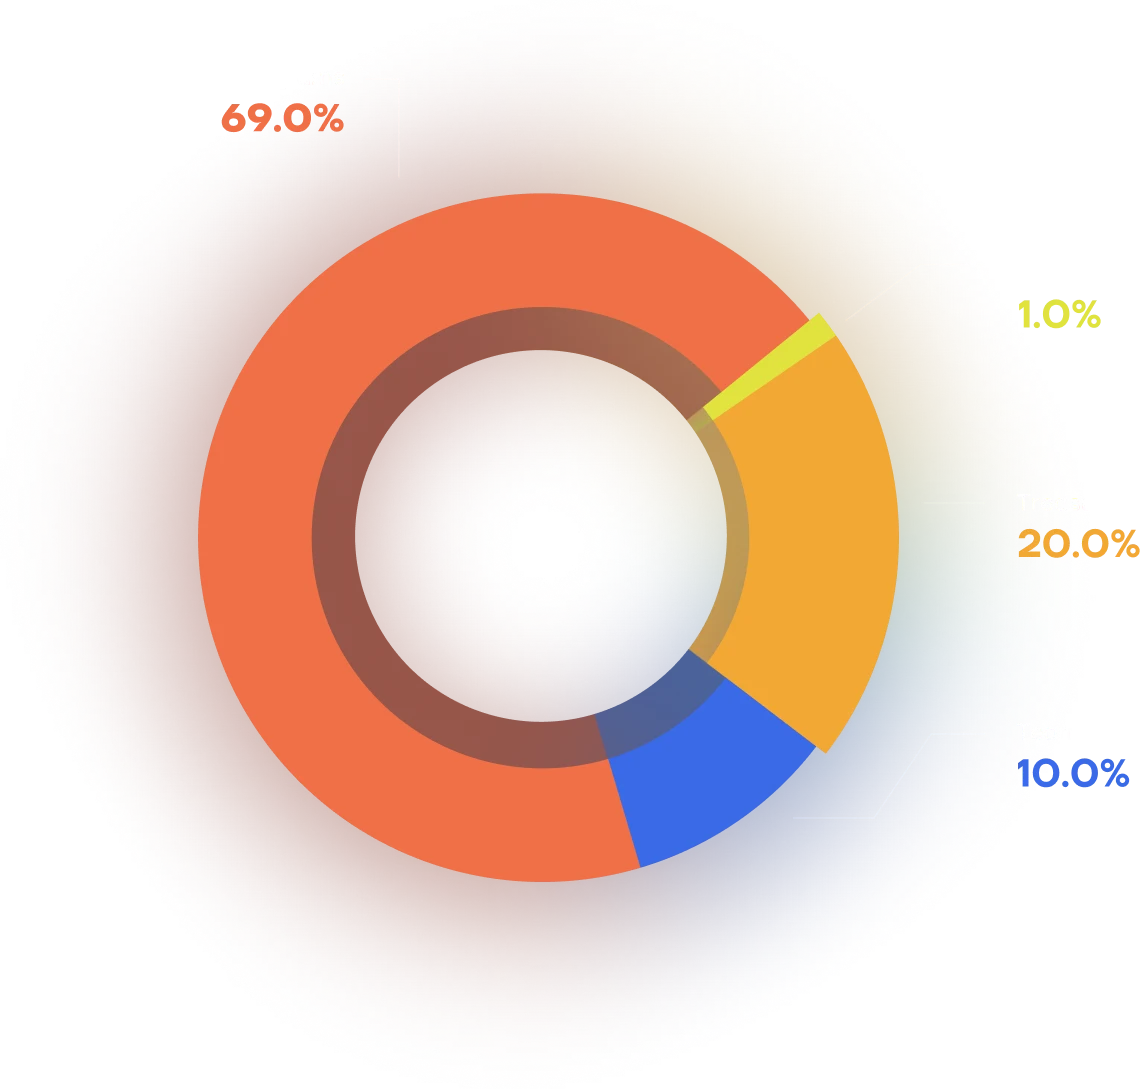
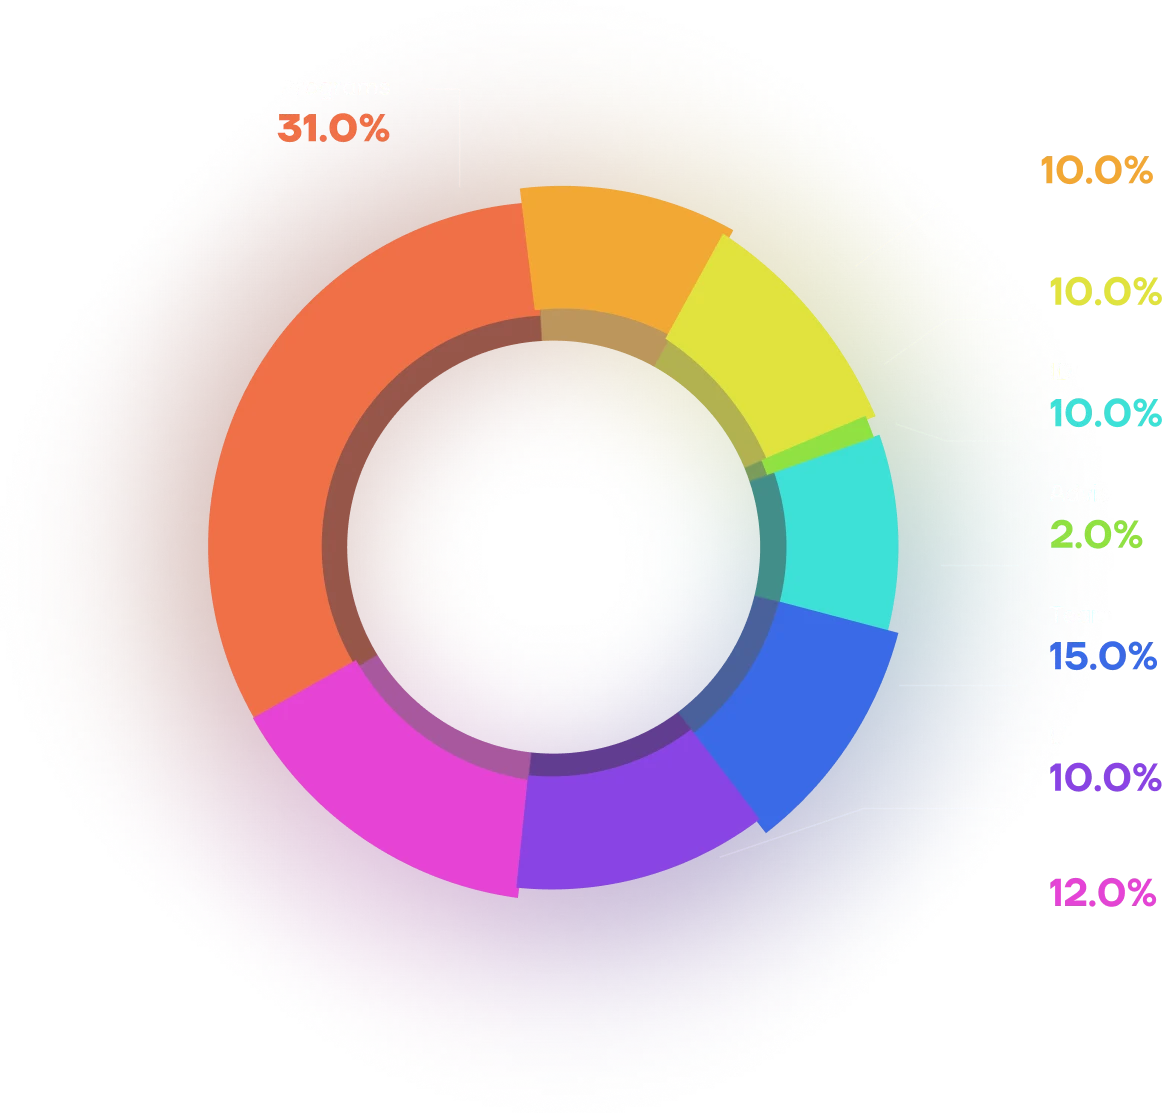
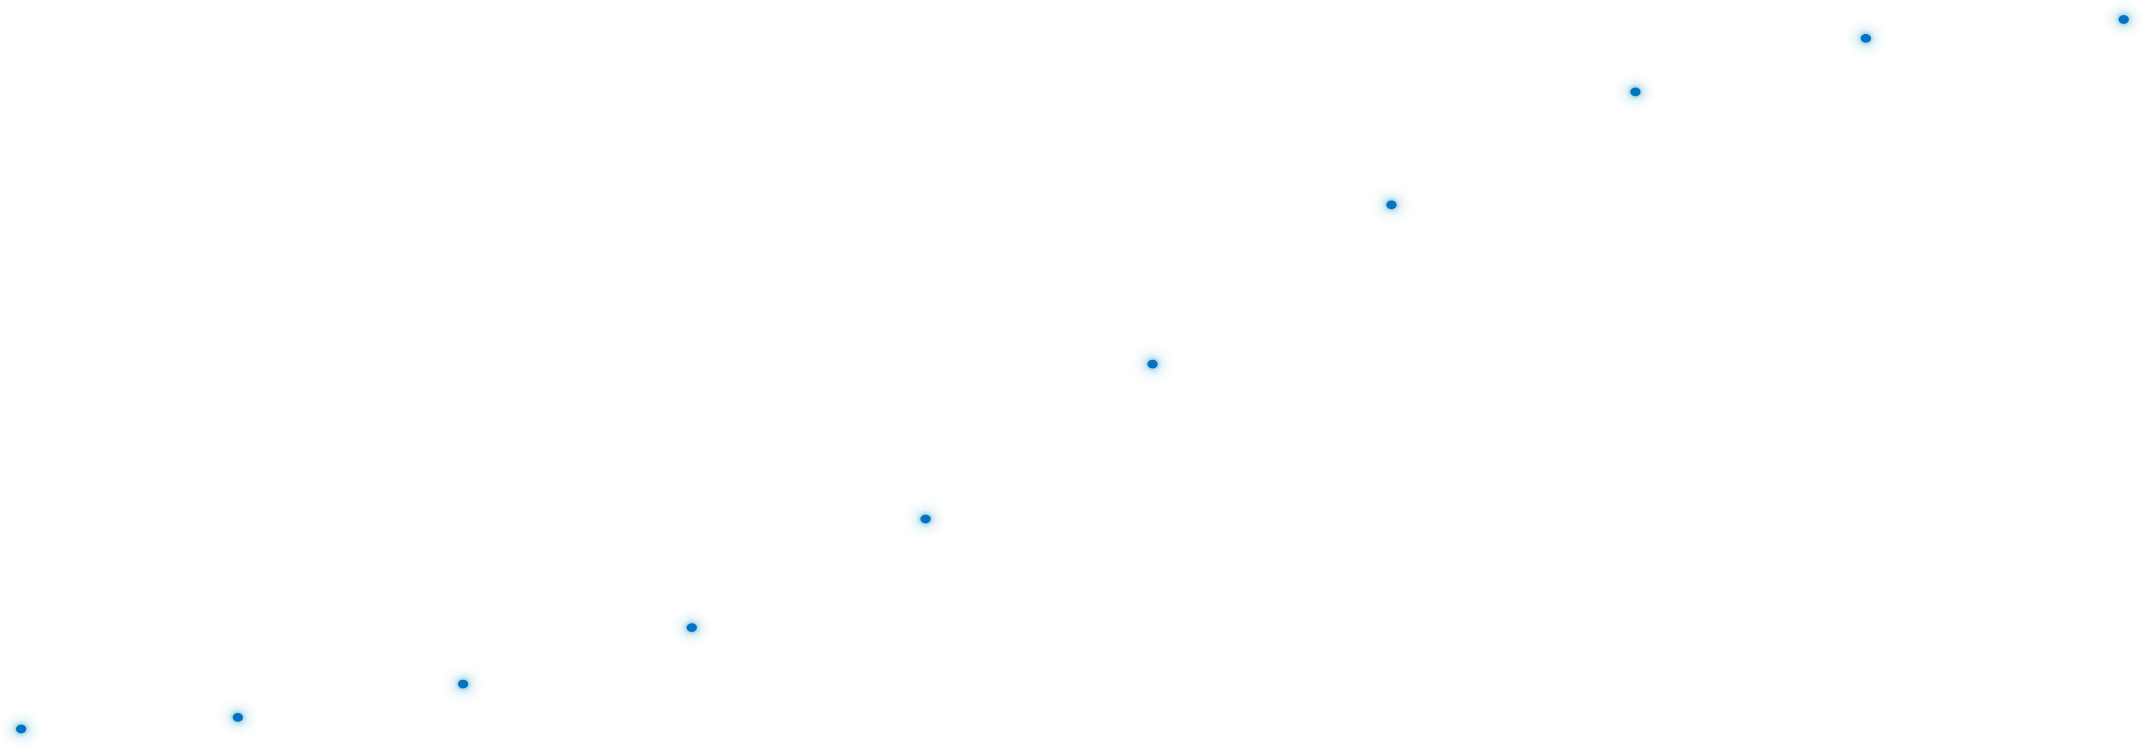
Tokenomics places two donuts side by side, initial and monthly distribution, with a soft glow under the segments and each share labelled in the colour of its slice, so neither chart needs a legend. Token Distribution is a single blue S-curve over horizontal guides. The roadmap sets each quarter as a large orange outline character behind the year in white, with short bulleted lists below, and the closing slide keeps one line and an orange contact address on the dark ground.



































Project facts
- More work in
- Pitch Decks & Presentations
- Related cases
- Optix Deck, Souq Deck, Banxe Deck
- See also
- Dequity