DeFi Dashboard Design: Staking Vaults, Positions and Fees on One Screen

DeFi dashboard design is the work of putting a user’s balance, the cost of the next action and the state of every automated position on one screen. thelegacy designs these dashboards and staking interfaces for web3 teams: the Souq vault flows, the Optix options dashboard and the Skynet market making dashboard below are our published examples.
The wider service is UX/UI and web design; this page shows what we put on the screen and why.
What should a DeFi dashboard show?
Five things: what the user owns, where it sits, what the next action will cost, what each automated position is doing, and what limits apply. The table maps each one to a screen in our own cases.
| What the screen has to answer | How it is solved in a case |
|---|---|
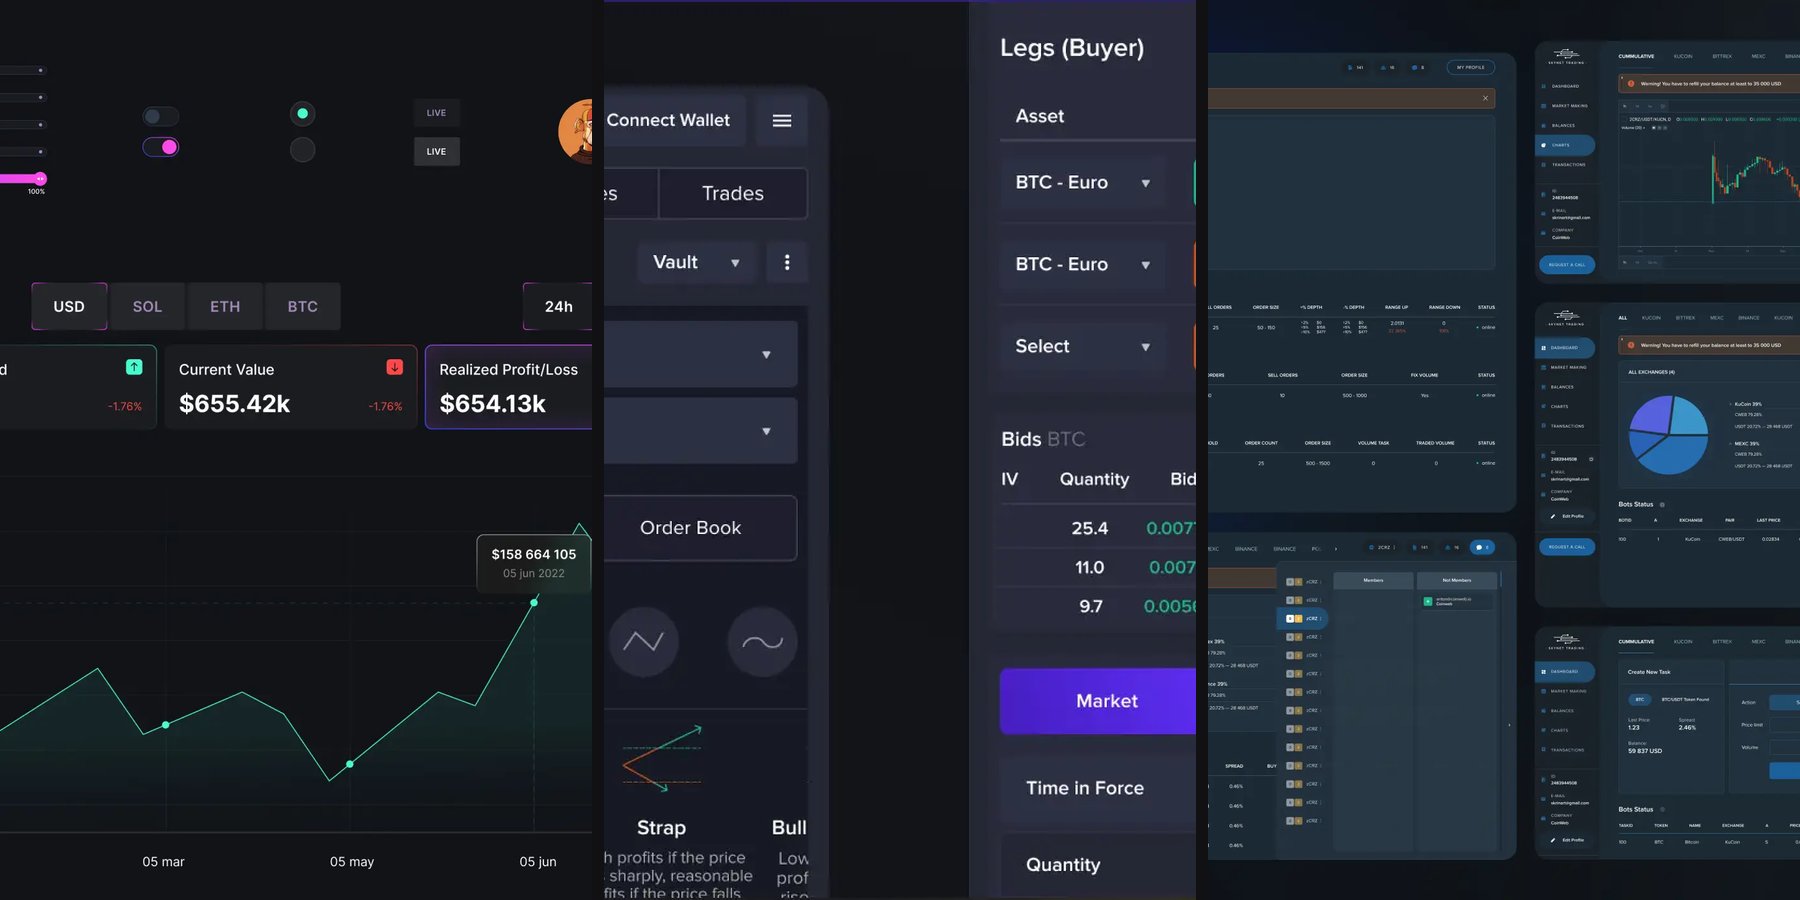
| What do I own, and how is it changing? | Souq portfolio: five KPI cards above an area chart that can be priced in USD, SOL, ETH or BTC |
| Where does the money sit? | Skynet dashboard: a pie chart of the balance split for each trading pair, with tabs for a cumulative view and single exchanges |
| What will this action cost? | Souq modals: fees itemised above the confirm button |
| What is the strategy in plain words? | Optix: strategy cards with a payoff sketch and one line of explanation |
| Is each automated position running? | Skynet: bot tables with a status column for each strategy |
How do you design a staking UI that shows the cost first?
Put every fee on the confirmation window, above the button, and make all the windows of the flow one family. In Souq, depositors put stablecoins into a vault such as ETH-Gaming, receive vault shares and earn rewards in game tokens. Select a Blockchain, Confirm Deposit, Buy and Sell Shares, Add and Remove Liquidity and Withdraw Rewards all follow one order: the vault name on top, amounts in dark tiles, fees, then one confirm button.
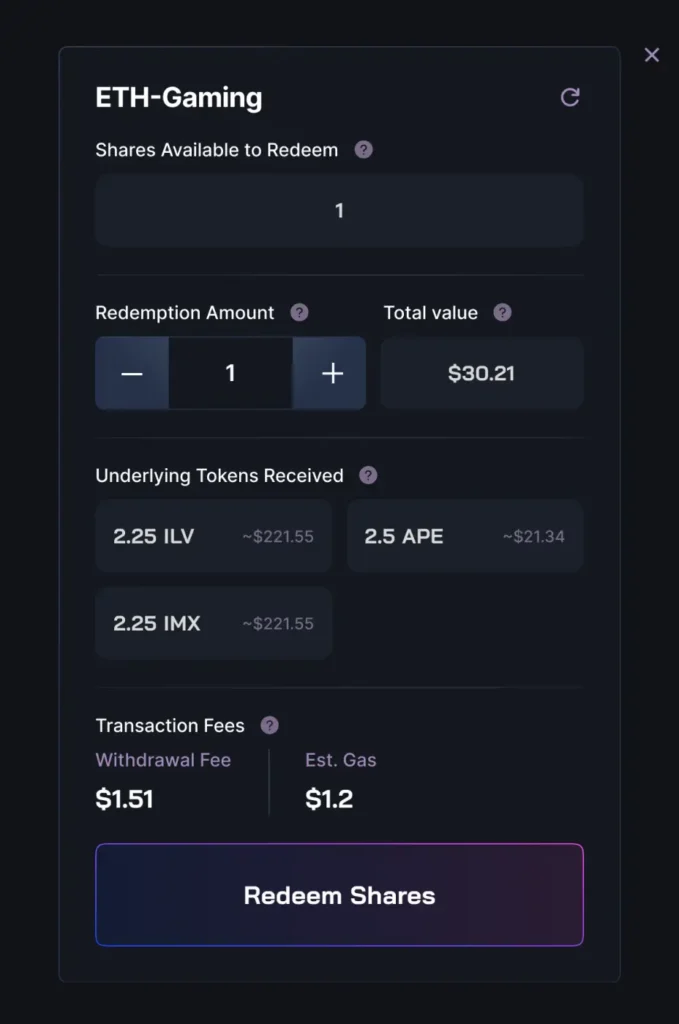
The decision we would repeat: fees are never behind an expander. In a flow where a signed transaction cannot be undone, a hidden cost is a design defect, not a layout choice.
How do you make a trading dashboard readable for non-experts?
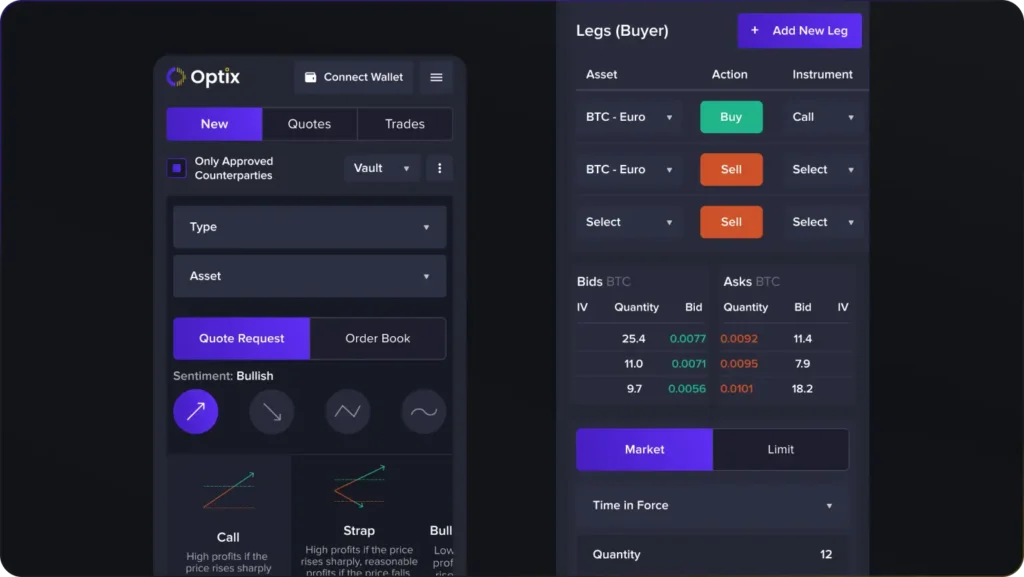
Start from the user’s view of the market and show the full order table second. Optix is an on-chain options protocol, and options are a niche product even in crypto. The dashboard opens on four sentiment toggles, from a rising arrow to a wave, then strategy cards such as Call, Strap and Bull Call Spread, each with a small payoff sketch and one plain line. Experienced traders still get the full Legs table, Market and Limit orders and a panel that limits a vault to approved counterparties.
What does a dashboard for automated trading need?
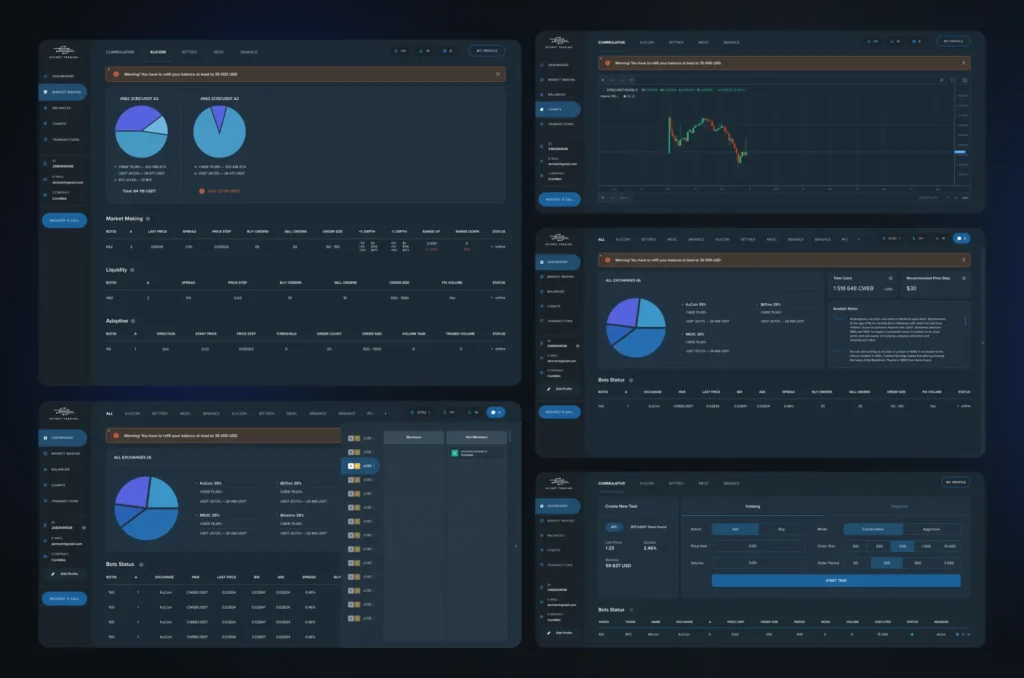
A map of the money and a status for every bot. The Skynet dashboard is where a token issuer follows the bots that trade its pairs. A sidebar holds Dashboard, Market Making, Balances, Charts and Transactions, tabs switch between a cumulative view and single exchanges, and the bot parameters sit in plain tables for market making, liquidity and adaptive strategies.
DeFi website design checklist: what to check before development
- The balance and its change are visible without a click.
- Every fee is listed before the confirm button.
- Every automated position shows a status.
- Colour carries meaning: gains, losses and flat values each have a fixed colour.
- The table turns into stacked label-and-value cards on a phone.
If you are building a DeFi product, the UX/UI design page shows how we work. Related reading: web3 wallet UX and fintech UX patterns that build trust.
Key takeaways
- Test for the screen: balance, the cost of the next action and the status of every automated position are visible without a single click.
- In Souq every window of the staking flow is built the same way and the fees are itemised above the confirm button, because a signed transaction cannot be undone.
- In Optix the dashboard opens on market sentiment instead of an order table; the full table stays for experienced traders.
Frequently asked questions
What is a DeFi dashboard?
A screen that gathers a user's decentralised finance data in one place: balance, positions, rewards and the cost of the next action. Its purpose is to let the user decide what to do next without switching between several apps.
What is a staking UI?
The part of a product where a user deposits assets into a vault or pool, follows rewards and withdraws. It differs from a trading terminal by leading with the state of the position instead of a price chart.
How is DeFi design different from regular fintech design?
A signed transaction cannot be undone, fees depend on the network and the data comes from the blockchain. So the cost and the consequences of an action have to be shown before the confirmation, not after.
What should the mobile version of a dashboard show?
The same things in a different shape: table rows become stacked label-and-value cards, and the balance and statuses stay on the first screen. In Optix each of the New, Quotes and Trades tabs has a mobile version.
How long does it take to design a dashboard like this?
It depends on the number of flows, the number of screen states and whether a design system already exists. Only a task description gives a guide, so we do not name general timelines.